Cover Crop Effect on Phosphorus and Potassium Fertilizer Recommendations for Soybean
Research was funded by the United Soybean Board
Nutifafa Adotey, Assistant Professor and Soil and Nutrient Specialist, Xinhua (Frank) Yin, Professor & Cropping System Scientist, Robert Florence, Director Soil, Plant and Pest Center, University of Tennessee
Introduction
Soil testing ensure proper plant nutrition, enhanced soil productivity, and profitability with minimal environmental impact on the ecosystem. There is limited information on P and K fertilizer recommendations for soybean systems that use cover crops, which has emerged as an important approach to improve soil health and build resilience for climate-smart agricultural production. In Tennessee, P and K fertilizer recommendations are based on Mehlich I extraction. However, most growers/crop consultants send samples to laboratories that use Mehlich III extractions. So, a calibration for Mehlich III was established for West Tennessee soils. Appropriate calibration would prevent under or over application of P and K fertilizers and enhanced profitability of the fertilizer applications. Soybean producers participating in NRCS’ Conservation Reserve Program rely on the University of Tennessee fertilizer recommendations in their production system. Image-based canopy sensing detects the real-time performance of plants. Previous work conducted in Kentucky suggests the normalized difference vegetative index can detect P and K soybean nutrient deficiencies. However, there is limited information on the use sensors to detect P and K soybean nutrient deficiencies. To address these challenges, we proposed to (1) evaluate soil test correlation and calibration from P and K fertility trials for soybean production systems with cover crops.
Research Methodology
Eight replicated small plot work was conducted in Tennessee in fields with different soil test P (STP) or soil test K (STK). All trial was set up as a randomized complete block design with 6 rates of P (0, 20, 40, 60, 80, and 120 lb P2O5 per acre using Triple Superphosphate (TSP)) and K (0, 40, 80, 120, 160, and 200 lb K2O per acre as Potassium Chloride (KCl)) with four replications (n = 24 for each nutrient). The STP and STK are reported in Table 1 and 2, respectively. Experimental plots were 4 rows wide by 30 feet long. Trials were managed in no-till fields with corn-soybean rotation and established in wheat cover crop. At maturity, the central two rows plots were harvested for yield at each of the sites. A linear and quadratic-plateau regression was used to estimate the optimum P and K rates required to attain the relative maximum grain yield at each location.


Findings
(i) Critical soil test values
Considering that prescribing reliable fertilizer recommendations hinges on determining an accurate critical soil test value (CSTV). The CSTV is the maximum soil test value below which the soybean crop is expected to show a yield increase with fertilizer application. In this study the CSTV for P at the responsive sites was 20 and 31 lb/A for Mehlich 1 (M1) and Mehlich 3 (M3) dataset, respectively using a linear quadratic model (Figure 1). In contrast, a Cate Nelson model was employed to determine the CSTV for K, which was 72 and 132 lb/A for M1 and M3 dataset (Figure 2).


(ii) Soybean response to P and K fertilization
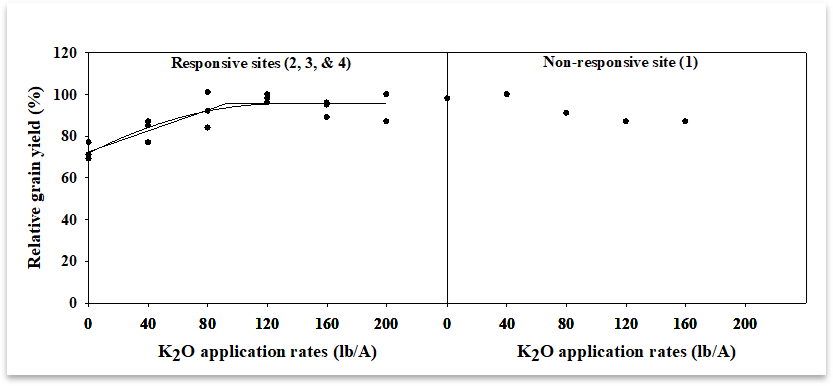
There was poor soybean response to P and K fertilizer applications when data from all the sites were plotted together for each nutrient. We observed soybean response to P fertilization at only 2 and K fertilization at 3 sites. At these responsive sites, the optimum P rate was approximately 20 lb P2O5/A, which is consistent with the current UT fertilizer recommendation for medium test soil (site 3) but lower than current recommendation for low test soil (Site 2) (Figure 3). The optimum K rate at the responsive sites was 90 and 120 lb K2O/A for the linear and quadratic model respectively (Figure 4). Both rates were higher than the current K recommendations for low testing soils.


Conclusion
In this study we generated critical soil test values (CSTV) for Mehlich 1 and Mehlich 3 P & K for soybean grown in a cover crop and determined the P and K fertilizer rates for optimum Soybean yield. Although additional years of study is required to generate robust information, the outcome of this study will suggest that recommendations for soybean production with or without cover crop may be the same.


